Lab
This lab brings together work at different stages: completed projects, prototypes and technical explorations that still have something to teach. It is not intended as a catalogue of new things, but as a record of how I tend to approach a question: test, measure, document, and acknowledge the limits of the tool as well.
Areas of exploration
Data
Cleaning, analysis, visualisation, automation and small reproducible workflows. Less epic narrative, more method.
Open tracking of official pandemic data
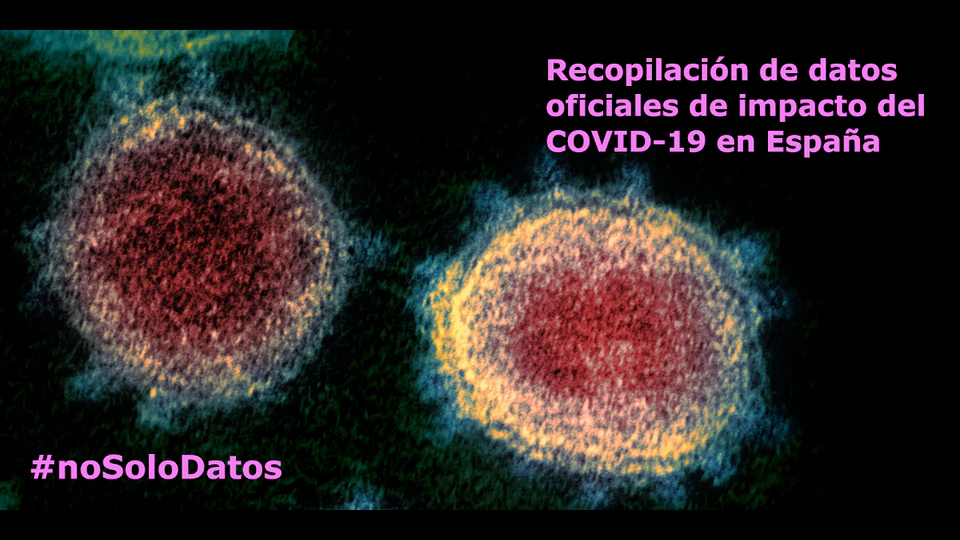
From 5 March to 5 June 2020, I maintained a daily record of official pandemic data, published it on the web and made it openly available on GitHub. It still strikes me as one of the pieces that best sums up how I combine data, documentation and public service: without much fanfare, and with a fair amount of sustained work behind it.
This project is especially important to me because it coincided with a particularly difficult period in my personal life, and the daily work also became a source of focus and refuge.
Other work from the same series:
Why can’t small displacements be measured with mobile phone accelerometers?
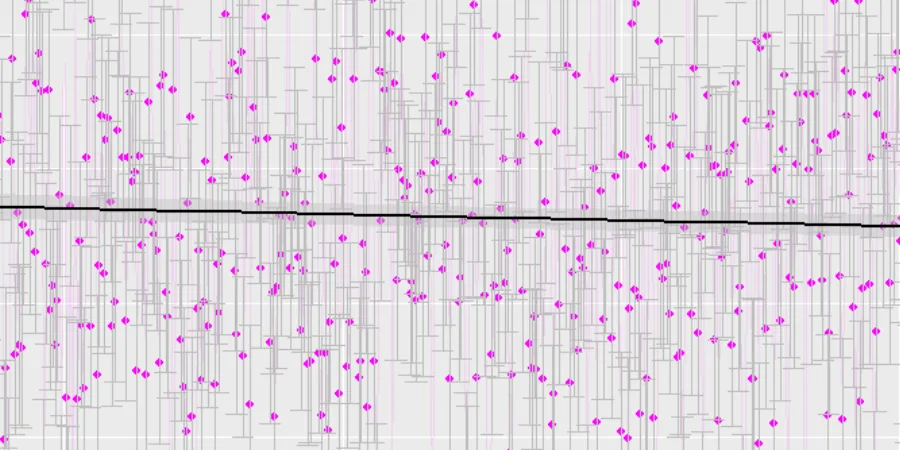
An anonymised version of a consultancy project for a clinical device. The report examines whether mobile phone sensors can measure small displacements, analyses real data and quantifies systematic and random errors before reaching the physical and computational limits of the method.
I retained only the basic physics that could be shared without compromising the confidentiality of the commission. It is a useful example of applied analysis in which a negative answer, when properly supported, is still a valuable result.
Baremos 2025
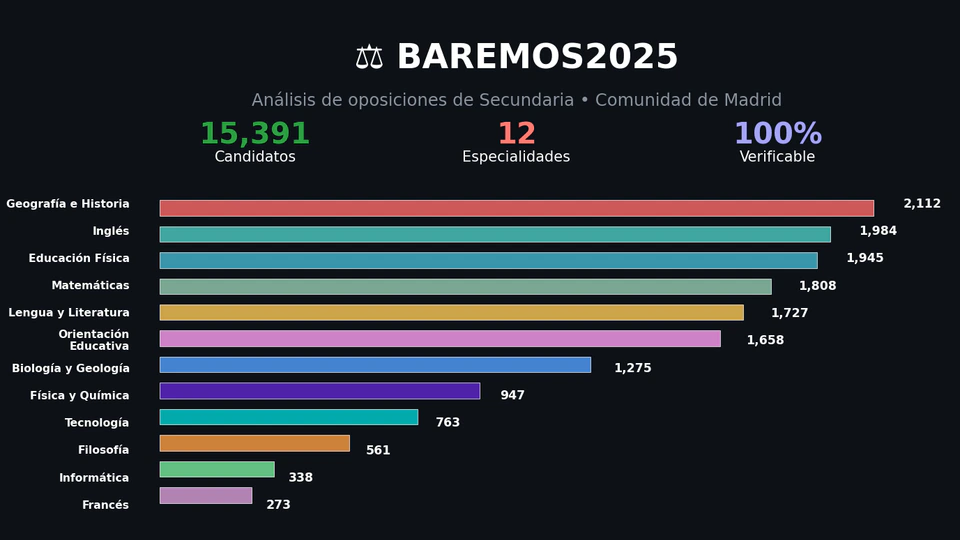
An applied analysis of the 2025 admission scores for several Spanish vocational qualifications. It carries less narrative weight than other projects, but plenty of practical value: it turns an administrative and teaching need into something clear, verifiable and reusable, which is no small thing when the usual alternative is opacity or wasted time.
Artificial intelligence
Experiments with models, assisted workflows, critical evaluation of tools and realistic uses in teaching and technical work. I find that considerably more interesting than easy dazzlement.
AppRA
A prototype for managing learning outcomes and assessment in vocational education and training, developed at an AI hackathon with Claude 4.7, where it ranked 23rd worldwide. It represents the kind of tool I think deserves to exist even while several edges remain rough, precisely because it tries to solve a specific need rather than merely prove that something can be done with AI.
OSINT and cartography
Intersections between open-source intelligence, territory, sources, maps and the spatial reading of problems. A rather particular territory, but a fertile one.
BuscOSINT
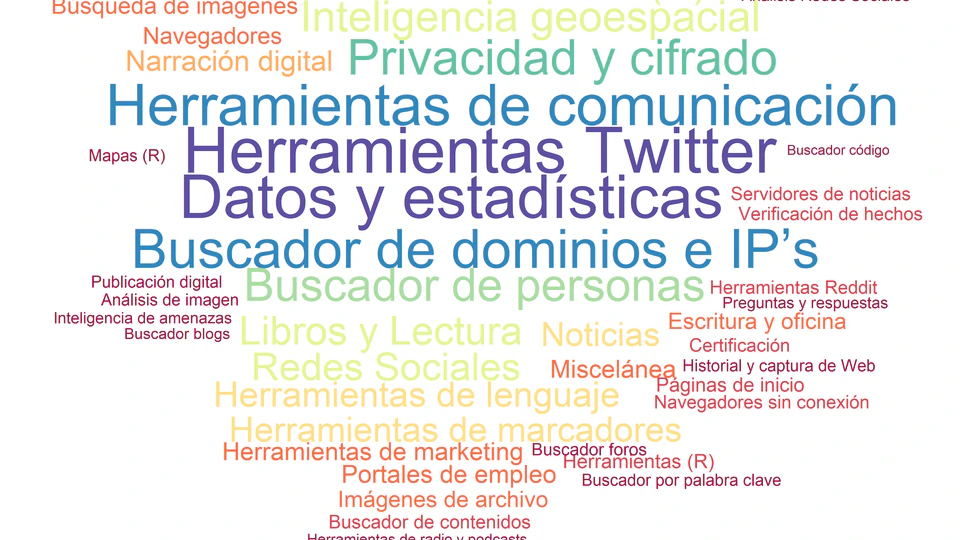
An intelligent search engine for OSINT resources, developed during a hackathon and awarded second place. I want to include it not only because of the result, but because it shows rather well the intersection between usefulness, specialist search and rapid prototyping when an idea finds a sensible way to land.
Maps with Leaflet for R
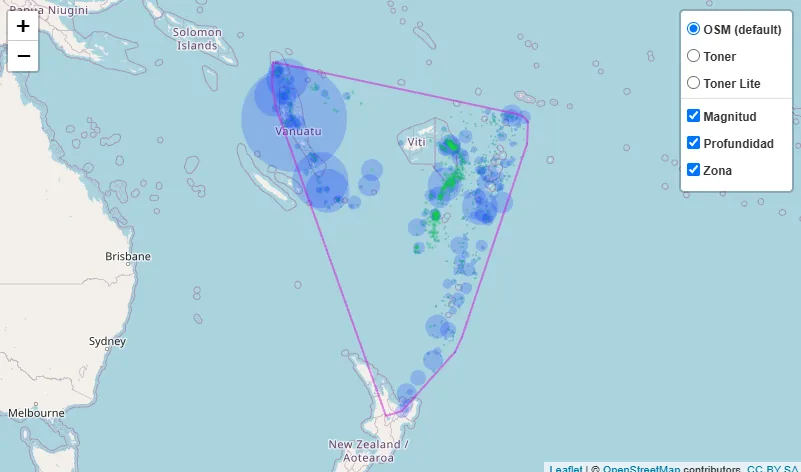
A practical notebook on interactive cartography with Leaflet for R, ranging from basic maps and seismic data to GeoJSON layers, controls, tile providers, and the integration of JavaScript code and plugins. Rather than a finished demonstration, it serves as a documented tour of the tool’s possibilities and limits.
Method
The lab is not a miscellaneous drawer, although it sometimes brushes against the edges of one. The aim is to make it a documented testing ground: try, measure, correct, and keep only what retains technical or intellectual interest.